Microsoft Excel is one of the most popular and widely used applications in offices and workplaces. It is a powerful tool for organising, analysing and visualising data. Having strong Excel skills can not only help you perform better at your job, but also make you stand out in interviews.
In this article, we will provide an ultimate guide to Excel basics interview questions. We will cover the fundamentals of Excel, common functions and formulas, data analysis features etc. By the end, you will have a solid grasp of Excel basics and feel confident tackling basic Excel interview questions.
Excel Basics Interview Questions On Fundamental Excel Concepts
What is a Cell in Excel?
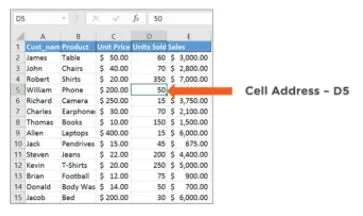
Cell – The intersection of rows and columns makes up a cell, the basic unit of an Excel worksheet. Cells can contain text, numbers or formulas.
What is a Row in Excel?
Row – Horizontal arrangement of cells. Excel worksheets have over 1 million rows.
What is a Column in Excel?
Columns – Vertical arrangement of cells. Columns are labeled A to Z then AA to AZ etc up to 16,384 columns.
What are Worksheets in Excel?
Worksheets – A collection of cells laid out in a grid format makes up a worksheet. This is where you enter and manipulate data.
What are Workbooks in Excel?
Workbooks – An Excel file containing one or more worksheets is called a Workbook. This serves as a container for all your data.
What are Tabs in Excel?
Tabs – Located at the bottom of the workbook, these tabs allow you to access different worksheets.
What are Ribbons in Excel?
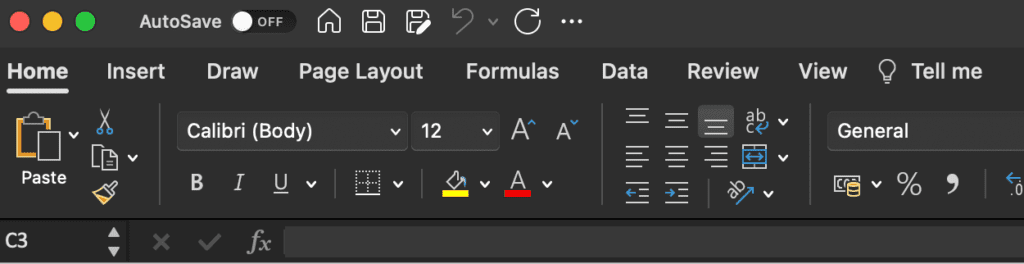
Ribbons – Located at the top, the ribbon contains icons grouped into tabs like Home, Insert, Formulas etc. It provides easy access to Excel tools and features.
What is a macro in excel?
A macro in Excel is a piece of programming code that automates routine tasks. Macros allow you to save a sequence of actions and replay them later with a single click or shortcut key.
Some key points about Excel macros:
- Macros are written in Visual Basic for Applications (VBA) – the built-in programming language in Excel.
- Macros can automate tasks like formatting data, manipulating worksheets, generating reports, importing/exporting data etc.
- Macros eliminate repetitive manual steps and ensure consistency.
- Macros can be run by assigning to buttons, shapes or keyboard shortcuts.
Excel Interview Questions On Essential Excel Functions and Formulas
Let’s see some of the excel related interview questions on Essential Excel Functions and Formulas:
Basic Functions
How do you use the SUM function to add up a range of numbers in Excel?
To add up a range of cells using SUM, you specify the range as the argument like =SUM(A1:A10) which adds all numbers from cell A1 to A10.
Explain the difference between AVERAGE, MEDIAN, and MODE functions.
| Function | Description | Example |
|---|---|---|
AVERAGE | Calculates arithmetic mean by adding values and dividing by count | =AVERAGE(1,2,3,4) = 2.5 |
MEDIAN | Returns middle value in dataset when arranged numerically | =MEDIAN(1,2,3,4) = 2.5 |
MODE | Returns most frequently occurring value in dataset | =MODE(1,1,2,3) = 1 |
- AVERAGE gives equal weightage to all values.
- MEDIAN gives equal weightage to order of values.
- MODE depends only on frequency of values.
- AVERAGE and MEDIAN can differ for skewed distributions.
- MODE may not exist if all values differ.
How would you count the number of cells with numeric values in a range using Excel?
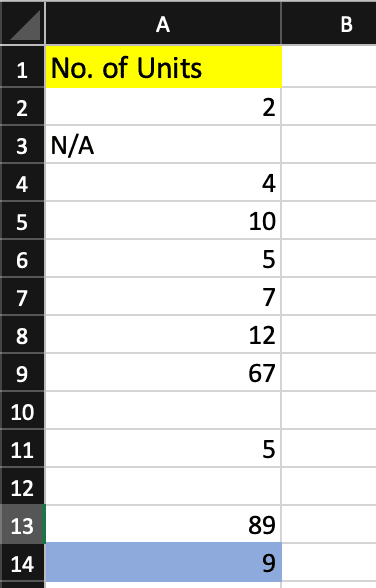
The COUNT function can be used to count only numeric cells in a range. For example, =COUNT(A2:A13) counts numeric values from A2 to A13.
Logical Functions
How do you use the IF function? Can you provide an example?
The IF function checks a logical condition and returns one value if True and another if False.
For example, =IF(A1>0,"Positive","Negative") displays Positive if A1 is greater than zero, else it displays Negative.
Explain the purpose of the AND and OR functions. How are they used in conjunction with the IF function?
AND and OR allow multiple logical conditions to be combined. For example, =IF(AND(A1>0,A1<10),"Within range","Out of range") checks if A1 is between 0 and 10.
Describe a scenario where you would use the IFERROR function.
IFERROR returns a custom value if a formula generates an error. This is useful to avoid ugly error values in calculations. For example, =IFERROR(VLOOKUP(...),"") displays blank if VLOOKUP fails.
Lookup Functions
How do you use the VLOOKUP function? What are its limitations?
The VLOOKUP function in Excel is used to search for a value in the first column of a table range and return a value in the same row from a specified column. The syntax for the VLOOKUP function is:
#VLOOKUP

=VLOOKUP(lookup_value, table_array, col_index_num, [range_lookup])
lookup_value: The value to search for in the first column of the table_array.table_array: The table range in which the data is located.col_index_num: The column index number from which the corresponding value should be returned. For example, if you want a value from the third column, you’d use 3.[range_lookup]: This is an optional argument. If TRUE (or omitted), VLOOKUP will look for an approximate match. If FALSE, VLOOKUP will look for an exact match.
What are its limitations?
- Exact Match Limitation: If you’re using VLOOKUP for an exact match (with
FALSEas the last argument), and the lookup value doesn’t exist in the table, it will return an error. - Approximate Match Issues: If you’re using VLOOKUP for an approximate match (with
TRUEas the last argument or omitted), the table must be sorted in ascending order, or the results can be incorrect. - First Column Lookup Only: VLOOKUP can only search for the lookup value in the first column of the table_array. If you need to search in a different column, you’d have to rearrange your data or use another function like
INDEXandMATCH. - Static Column Reference: If you add or remove columns from your table, the
col_index_nummight return data from the wrong column unless you adjust it.
Explain the difference between VLOOKUP and HLOOKUP.
| Feature | VLOOKUP | HLOOKUP |
|---|---|---|
| Purpose | Searches for a value in the vertical column of a table and returns a value from the same row in a specified column. | Searches for a value in the horizontal row of a table and returns a value from the same column in a specified row. |
| Lookup Direction | Vertical (Column-based) | Horizontal (Row-based) |
| Syntax | =VLOOKUP(lookup_value, table_array, col_index_num, [range_lookup]) | =HLOOKUP(lookup_value, table_array, row_index_num, [range_lookup]) |
| Lookup Value | Searches in the first column of the table_array. | Searches in the first row of the table_array. |
| Return Value | Returns value from a specified column in the same row. | Returns value from a specified row in the same column. |
| Common Use Case | When data is organized in columns (e.g., a list of products in one column and their prices in another). | When data is organized in rows (e.g., months in the first row and sales data in subsequent rows). |
HLOOKUP..Both VLOOKUP and HLOOKUP are used for lookup and reference purposes, but the direction of the search and the structure of the data determine which function is more appropriate to use.
How does the INDEX and MATCH combination differ from VLOOKUP?
INDEX/MATCH provides more flexibility than VLOOKUP in looking up values from a matrix since you specify separately the row and column indexes to match.
Basic Excel Interview Questions On Date and Time Functions
How would you calculate the difference between two dates in Excel?
The DATEDIF function can calculate difference between dates in days, months or years. For example, =DATEDIF(A1,TODAY(),"D") gives difference between A1 and today in days.
Explain the purpose of the TODAY and NOW functions.
TODAY gives current date, while NOW gives current date and time. They are useful for date comparisons or datestamping records.
How do you use the DATEVALUE function?
DATEVALUE converts a text string into a serial date value that Excel recognizes as a date. This allows dates in text format to be used in date calculations.
Text Functions
How do you concatenate two or more strings in Excel?
The CONCAT or & operator can concatenate strings. For example, =CONCAT(A1,B1) joins text in cells A1 and B1.
Explain the difference between LEFT, RIGHT, and MID functions.
- LEFT: This function extracts a specified number of characters from the beginning (left side) of a text string.
- RIGHT: This function extracts a specified number of characters from the end (right side) of a text string.
- MID: This function extracts a specified number of characters from the middle of a text string, starting from a specified position.
In the provided example, the input text is “Hello World,” and the functions are applied as follows:
LEFT("Hello World", 5)extracts the leftmost 5 characters, resulting in “Hello.”RIGHT("Hello World", 5)extracts the rightmost 5 characters, resulting in “World.”MID("Hello World", 7, 5)extracts 5 characters starting from the 7th position, resulting in “World.”
How would you use the LEN function in conjunction with other text functions?
LEN gets the character length of a string. It can be used to dynamically specify the number of characters to extract using functions like LEFT and MID.
Mathematical Functions
How do you round a number to a specified number of decimals using Excel?
The ROUND function rounds numbers to a desired decimal place.
For example, =ROUND(2.456,1) rounds 2.456 to 2.5 to 1 decimal place.
Describe the purpose of the INT, ROUNDUP, and ROUNDDOWN functions.
| Function | Purpose | Syntax | Example | Result (if applied to 5.7) |
|---|---|---|---|---|
| INT | Rounds down to nearest integer | INT(number) | INT(5.7) | 5 |
| ROUNDUP | Rounds up to specified decimals | ROUNDUP(number, num_digits) | ROUNDUP(5.3, 0) | 6 |
| ROUNDDOWN | Rounds down to specified decimals | ROUNDDOWN(number, num_digits) | ROUNDDOWN(5.7, 0) | 5 |
INT, ROUNDUP, and ROUNDDOWN functions.These functions are helpful for various mathematical and financial calculations where you need to round or truncate numbers to specific precision or formats.
How would you generate a random number between 1 and 100?
This formula generates a random number between 1 and 100:=RANDBETWEEN(1,100)
Array Formulas
What is an array formula, and how is it different from regular formulas?
Array formulas work on multiple values simultaneously instead of a single value. They are entered by pressing CTRL + SHIFT + ENTER rather than just ENTER.
How do you perform a multi-cell array formula?
To span array formula results over multiple cells, select output range before entering formula and press CTRL + SHIFT + ENTER.
Provide an example of when you would use an array formula in a real-world scenario.
Array formulas can calculate summary stats like mean, median etc. in one step over large datasets where regular formulas require helper columns.
Advanced Functions
How do you use the SUMIFS function to sum values based on multiple criteria?
SUMIFS allows summing only cells that meet multiple criteria. For example, =SUMIFS(Sales,$Date,">=1/1/2020",$Region,"East") sums Sales for Date after 1/1/2020 and Region East.
Explain the purpose of the DSUM function and how it differs from SUMIFS.
DSUM sums values in a database field meeting given criteria. Unlike SUMIFS, range names instead of cell ranges are used as parameters to refer to the database table and field names.
Describe a scenario where you would use the OFFSET function.
OFFSET returns a range reference shifted rows and columns from a starting reference. This is useful to refer to ranges relatively based on changing data.
Data Analysis
Let’s look into some of the excel interview questions data analyst might get asked in their interview process :
How would you use the FREQUENCY function to create a histogram?
FREQUENCY calculates how often values occur within ranges. Feeding this output into a column chart displays a histogram distribution.
Explain the purpose of the RANK function.
RANK returns the rank of a value relative to other values in a dataset. For example, =RANK(A1,$A$1:$A$100) returns ranking of A1 compared to values from A1 to A100.
How do you use the FORECAST function to predict future values based on historical data?
The FORECAST function in spreadsheet software like Microsoft Excel is used to predict future values based on historical data using linear regression. It calculates a predicted value (y) for a given x-value (independent variable) using a linear equation derived from the historical data.
Here’s how to use the FORECAST function to predict future values based on historical data:
Organize Your Data:
- Ensure that you have two columns of data: one for the independent variable (x-values) and another for the dependent variable (y-values). The historical data should be in sequential order.
Calculate the Slope and Intercept:
- To use the FORECAST function, you need to calculate the slope (m) and the intercept (b) of the linear regression equation, typically done using the
SLOPEandINTERCEPTfunctions. For example, if your independent variable is in column A and the dependent variable is in column B, you can calculate the slope and intercept like this: - Slope (m):
=SLOPE(B2:Bn, A2:An)(where n is the last row of your data) - Intercept (b):
=INTERCEPT(B2:Bn, A2:An)
Use the FORECAST Function:
- Now that you have the slope and intercept, you can use the FORECAST function to predict future values. Let’s say you want to predict a value for a specific x-value (x_new):
=FORECAST(x_new, A2:An, B2:Bn) x_newis the x-value for which you want to predict a corresponding y-value.A2:Anrepresents the range of historical x-values.B2:Bnrepresents the range of historical y-values.
Get the Prediction:
- After entering the formula, the cell will display the predicted y-value for the given x-value.
Miscellaneous
How do you convert text to columns using a formula?
The TEXT TO COLUMNS function can split delimited text from a single column into multiple new columns.
Describe the TRANSPOSE function and its use cases.
TRANSPOSE flips a vertical range horizontally or vice versa. This is useful to convert vertical data to a horizontal table layout and vice versa.
How would you use the HYPERLINK function to create a clickable link in a cell?
HYPERLINK("http://www.example.com","Link Text") creates a clickable link with “Link Text” displayed and redirects to the URL.
Additional Excel basics interview questions
Let’s see some of the excel related interview questions for beginner
Basic Excel interview questions: Beginner Level
How can you insert rows and columns in Excel?
In Microsoft Excel, you can easily insert rows and columns to expand your worksheet or adjust the layout of your data. Here’s how you can insert rows and columns:
To Insert Rows:
- Select the Row(s): Click on the row number(s) below where you want to insert new rows. If you want to insert multiple rows, select as many row numbers as needed.
- Right-Click and Choose “Insert” (Option 1): Right-click on the selected row number(s), and a context menu will appear. From this menu, choose “Insert.” New rows will be inserted above the selected row(s).
- Use the Ribbon (Option 2): Alternatively, you can use the Ribbon at the top. Go to the “Home” tab, find the “Cells” group, and click on “Insert.” Then, select “Insert Sheet Rows.” This will also insert new rows above the selected row(s).
To Insert Columns:
- Select the Column(s): Click on the column letter(s) to the right of where you want to insert new columns. For multiple columns, select as many column letters as needed.
- Right-Click and Choose “Insert” (Option 1): Right-click on the selected column letter(s), and a context menu will appear. From this menu, choose “Insert.” New columns will be inserted to the left of the selected column(s).
- Use the Ribbon (Option 2): Alternatively, you can use the Ribbon. Go to the “Home” tab, find the “Cells” group, and click on “Insert.” Then, select “Insert Sheet Columns.” This will insert new columns to the left of the selected column(s).
What are absolute, relative and mixed cell references in Excel?
| Reference Type | Symbol | Example | Behavior |
|---|---|---|---|
| Absolute Reference | $A$1 | $A$1 | Does not change when copied or filled down. |
| Relative Reference | A1 | A1 | Adjusts relative to the destination cell. |
| Mixed Reference | $A1 or A$1 | $A1 or A$1 | One part is absolute, one is relative. |
Excel basics interview questions: Intermediate Level
Let’s see some of the excel related interview questions for Intermediate
What is the IF function used for in Excel?
The IF function allows you to check a condition and perform different actions based on whether the condition evaluates to TRUE or FALSE. It is used to make logical comparisons and decisions.
How can you share only certain parts of an Excel workbook with others?
By using sheet protection and passwords, you can selectively share only certain worksheets or ranges in a workbook while keeping other parts private.
What is a PivotTable and when would you use one?
A PivotTable allows you to easily summarize and analyze large datasets. You can filter, sort and reorganize data on the fly. They are best suited for quick ad hoc data analysis.
What is Difference between Pivot charts and standard charts.
| Aspect | Pivot Charts | Standard Charts |
|---|---|---|
| Data Source | Derived from PivotTables, | Directly created from a range of |
| which summarize data from | data in a worksheet. | |
| the source data. | ||
| Data Structure | Typically used for analyzing | Used for visualizing raw data or |
| summarized data and | specific data series without | |
| showing trends or patterns. | summarization. | |
| Interactivity | Offers dynamic filtering and | Static, with limited interaction |
| slicing of data using Pivot | options (e.g., you can’t drill | |
| Table controls. | down into data as in Pivot | |
| Charts). | ||
| Data Aggregation | Aggregates data within the | Requires pre-aggregation of data |
| PivotTable and allows for | if needed. | |
| calculations on the fly. | ||
| Chart Types | Limited selection of chart | Wide variety of chart types |
| types optimized for Pivot | available, suitable for various | |
| Charts, such as Pivot Column | data visualization needs. | |
| Ease of Use | Well-suited for summarizing | Straightforward for simple data |
| and exploring large datasets | visualization but may not offer | |
| with dynamic filters. | advanced analysis features. | |
| Flexibility | Less flexible when it comes | Highly flexible, allowing |
| to chart customization and | extensive chart formatting and | |
| formatting options. | customization. | |
| Integration with PivotTables | Seamlessly integrated with | Separate from PivotTables; |
| PivotTables; changes in one | updates require manual data | |
| affect the other. | manipulation or refresh. | |
| Purpose | Mainly for data analysis and | Suitable for data visualization |
| summarization within a | and presentation of specific | |
| PivotTable context. | data or trends. |
Excel basics interview questions: Advanced Level
Let’s see some of the excel related interview questions for advanced level:
How can you use Excel for complex statistical analysis?
To use Excel for complex statistical analysis:
- Organize your data.
- Use Excel functions for basic stats.
- Create charts for visualization.
- Perform hypothesis tests, regression, and correlation.
- Use Excel’s probability functions.
- Apply data sampling techniques.
- Utilize add-ins for advanced analysis.
- Consider third-party Excel add-ins.
- Keep data clean and structured.
- Excel has limitations; for advanced analyses, consider specialized statistical software.
Excel’s Data Analysis ToolPak provides advanced statistical functions like correlation, ANOVA, regression etc. that can be applied to your datasets for statistical analysis.
How can you optimize large Excel models to improve performance?
Techniques like turning off automatic calculations, simplifying formulas, limiting formatting, using efficient range names, and Structured References can optimise Excel performance.
What is a Power Pivot model and what are the benefits of using it?
Power Pivot integrates large volumes of data from various sources into a data model for fast querying and analysis. It enables high performance reporting without slow formulas.
How can you use dynamic named ranges in Excel dashboards and reports?
Using the INDEX formula to define named ranges avoids manually updating ranges when data changes. It allows dashboards to always show latest data.
Conclusion
We have covered a wide variety of concepts that assess your knowledge of Excel basics interview questions. Being comfortable with Excel fundamentals, analysis tools and visualisation features is key not just for interviews but also for workplace success.
So be sure to thoroughly go through these common Excel related interview questions, practice creating sample data models and charts, and think about how Excel can provide solutions for different business scenarios. This will help you stand out as an exceptional candidate for any data-related roles in finance, operations, marketing or other fields.
Try out our free resume checker service where our Industry Experts will help you by providing resume score based on the key criteria that recruiters and hiring managers are looking for.
Common Mistakes and Best Practices
Avoid these common Excel mistakes:
- Using Formulas Inconsistently – Use structured references like named ranges/tables instead of cell addresses
- Not Using Functions Properly – Know limitations of functions to avoid wrong results
- Leaving Blank Cells in Formulas – Use IFERROR or similar to handle errors
- Using Wrong Data Types – Be careful with numbers stored as text
Best practices:
- Document your worksheet – Add headers, legends, notes to explain logic and sources
- Proofread formulas – Check precedence, Nested formulas can get complex
- Control external links – Reduce reliance on links to other workbooks/sheets
- Make backups – Save your workbook frequently to avoid data loss
Additional Resources For Basic Excel Interview Questions
Additional Resources For Basic Excel Interview Questions :
- Introduction to Excel Course – LinkedIn Learning
- Excel Data Analysis Masterclass – Udemy
- “Excel Basics In 30 Minutes” by Ian Lamont
- Excel Forum – Tech Community
- Excel for Beginners Guide – Lifewire
FAQs Related To Excel Basics Interview Questions
Some of the FAQs Related To Excel Basics Interview Questions are:
Q: How is Excel different from a database?
A: Excel is a spreadsheet application optimzed for ad hoc analysis while databases are better for structured storage and retrieval of large datasets. Excel can connect to external databases to extract data for analysis.
Q: What are some limitations of Excel?
A: Excel has file size limits, limited data security, risk of human errors in formulas, and difficulty in tracking workbook versions or history. Proper data validation and discipline is required to overcome limitations.
Q: Can Excel be used on mobile devices?
A: Yes, the Excel mobile app provides basic editing and viewing capabilities with some limitations. The full desktop Excel version offers the complete feature set.
References Related To Excel Basics Interview Questions
References Related To Excel Basics Interview Questions are: